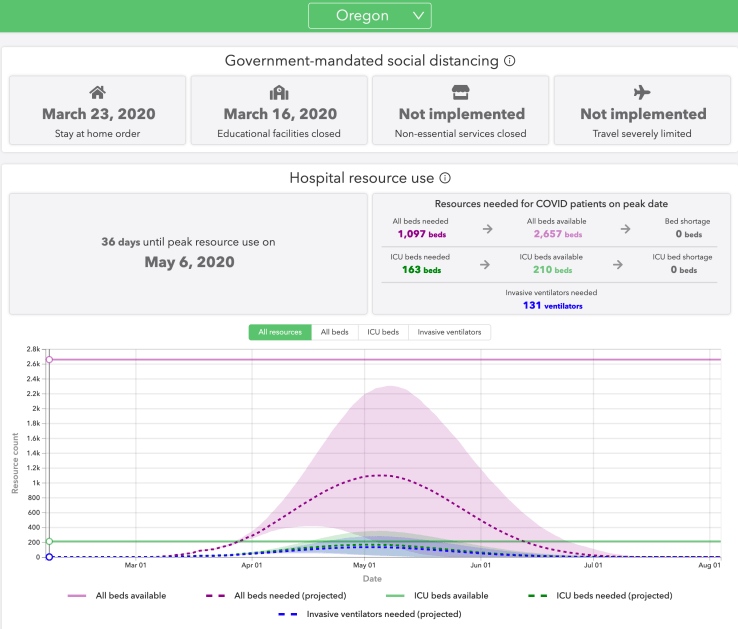
The Institute for Health Metrics and Evaluation an independent population health research center at UW Medicine, part of the University of Washington created a national projections database of hospital resource use in the United States as a whole and state by state. You can view Oregon’s curve and when it will peak. This is a statistical model that will keep updating as more data comes in. The model assumes continued social distancing until the end of May 2020 in Oregon.
http://covid19.healthdata.org/
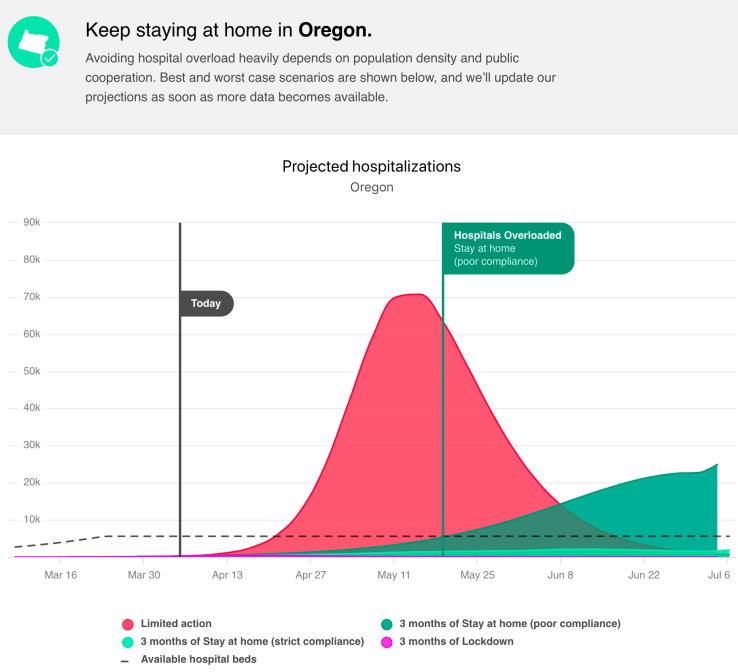
Another data tracking website: Covid ActNow